Gold Price Technical Analysis: 50-Week SMA Reclaim Becomes Key Bull Trigger

Gold is trading below its 50-week simple moving average for the first time since September 2023, turning the $4,320 area into the main level for bulls to reclaim on the weekly chart.
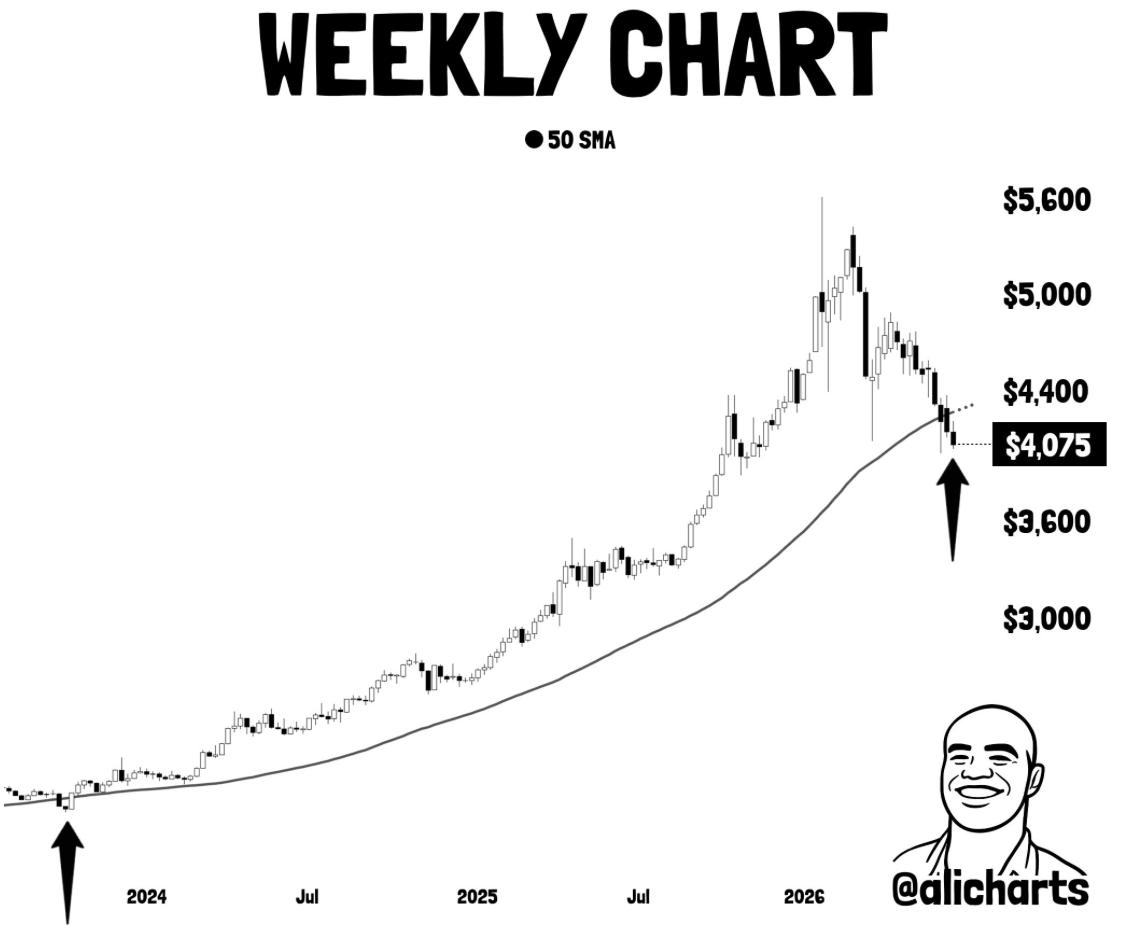
XAU/USD recently traded near $4,069, with the day’s range stretching from roughly $4,050 to $4,115. That leaves gold under the 50-week SMA area highlighted by Ali Martinez’s latest chart, which places the moving average near $4,320.
The setup is technically important because gold has been in a broad correction since reaching record highs above $5,500 earlier this year. Investing.com data places the 52-week range between roughly $3,248 and $5,595, while front-month Comex gold recently settled at $4,181.90, down 1% on the day.
Gold now sits between two clean zones. The first is the lower support band around $4,050 to $4,000, where buyers need to defend the current correction from turning into a deeper breakdown. The second is $4,320, where a weekly close back above the 50-week SMA would show that buyers have regained control of the medium-term trend.
The 2023 Comparison Sets The Bullish Case
Martinez compared the current setup with September 2023, when gold briefly dipped below its 50-week SMA before reclaiming it in early October. That reclaim preceded a major rally from roughly $1,932 to the recent $5,600 area.
The historical comparison gives traders a simple roadmap, but it should not be treated as a repeatable guarantee. A moving-average reclaim can mark a trend reversal when buyers return with volume, macro support and follow-through. It can also fail if the price closes back above the average briefly and then loses it again.
The bullish setup needs a weekly close above $4,320, followed by acceptance above that level. If gold reclaims the 50-week SMA and holds it as support, the next resistance areas sit near $4,450, $4,600 and $4,850. A stronger continuation could reopen the path toward $5,200, where several bullish gold forecasts have clustered during this cycle.
The bearish setup is just as clear. Failure to reclaim $4,320 keeps gold below its medium-term trend line and leaves the market vulnerable to another test of $4,050 and $4,000. A weekly close below $4,000 would weaken the buying-opportunity argument and expose a deeper retracement toward the $3,850 to $3,700 zone.
Macro Pressure Still Matters For Gold
Gold’s technical setup is being shaped by rates, the dollar and risk appetite. Recent pressure followed a more hawkish Federal Reserve backdrop, which raised the opportunity cost of holding a non-yielding asset. A stronger dollar can also pressure gold by making it more expensive for non-U.S. buyers.
That macro pressure has already hit broader markets. U.S. equities traded unevenly as the Dow erased early losses while tech stocks stayed under pressure, and South Korea’s AI-heavy market selloff spilled into global risk assets during the KOSPI’s near-10% drop. Gold has not been immune to that cross-asset deleveraging, especially after a powerful rally left it extended earlier in the year.
The next clean gold trade depends on the weekly close. A move back above $4,320 would put the 50-week SMA back under buyers’ control and shift attention toward $4,450 and $4,600. A failed reclaim keeps the market pinned below trend resistance, with $4,050 and $4,000 as the support levels that decide whether the correction stays orderly or opens a deeper downside leg.


Post Comment
You must be logged in to post a comment.